
Ride the Simplicity Cycle
The Simplicity Cycle equips teams with a visual vocabulary for assessing a design’s complexity and value. It can be applied to everything from system architectures and business processes to reports and presentations.
The Simplicity Cycle diagram is shown below, with five numbered points depicting various phases in the Cycle.
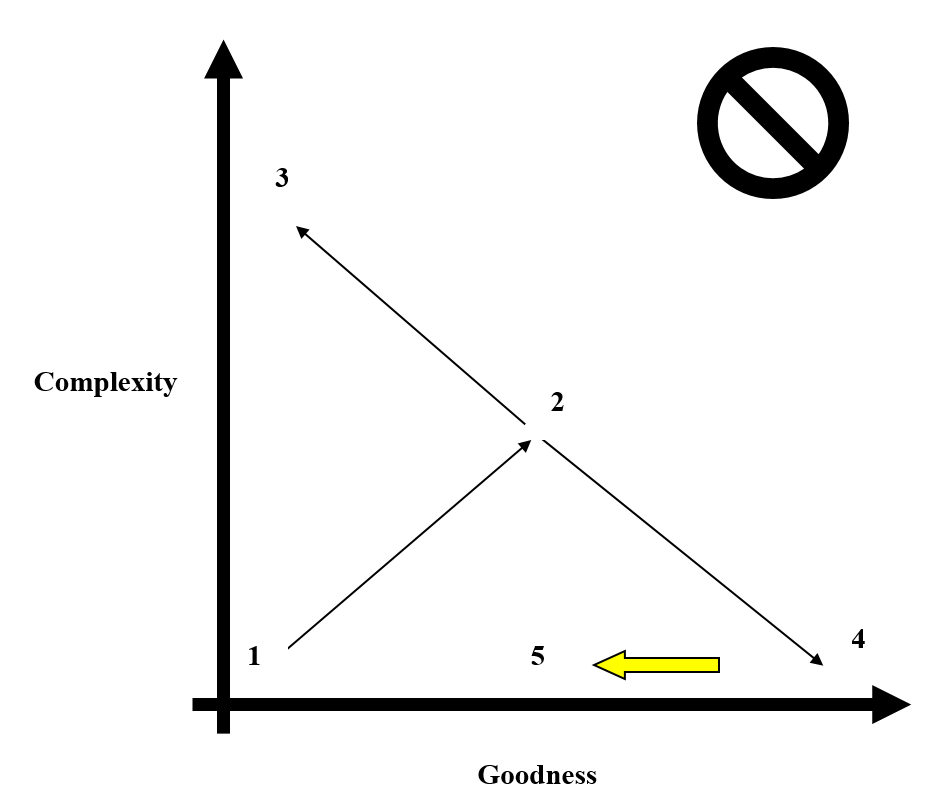
1 – The START point. The design is simple, basic, immature, and delivers little value. The best move involves additive strategies that increase complexity and introduce new components, features, or concepts (e.g. brainstorming, prototyping).
2 – The SHIFT point. The design has accumulated a critical mass of complexity and now delivers significant value. Now the best move is to adopt reductive strategies that decrease complexity (e.g. trimming, stormdraining).
3 – The STOP point. The design has accumulated too much complexity, which overwhelms value. The best move is to take a pause, then use reductive tools to significantly reduce complexity. At this point, it may be wise to scrap it and start over from scratch.
4 – The SHIP point. The design is elegant: simple and effective, providing maximum value. Declare it complete and send it out into the world!
5 – The yellow arrow indicates time pushing things in the direction of decreased goodness, as yesterday’s breakthroughs become tomorrow’s commodities. This brings us back to point 1, where the cycle starts all over again.
Actions You Can Take
- Download the Simplicity Cycle Workbook for a step-by-step guide
- Download the Simplicity Cycle Manifesto for a slightly more detailed overview.
- Watch this short Simplicity Cycle video with your team (or the longer video for a more in depth explanation).
- Read the Simplicity Cycle book with your team
- Use the Simplicity Cycle framework to guide a discussion with your team, stakeholders, customers, etc.