
Engineering and Manufacturing Development (EMD) Phase

Agile Fundamentals Overview
Agile Glossary
MATERIEL SOLUTION ANALYSIS (MSA) PHASE
Materiel Development Decision (MDD)
Analyze Requirements
Analysis of Alternatives (AoA)
Develop Acquisition Strategy
Market Research
Cost Estimation
Risk Management
TECHNOLOGY MATURITY AND RISK REDUCTION (TMRR) PHASE
Milestone A
Mature Requirements
Competitive Prototyping
Systems Engineering
Mature Acquisition Strategy
Contract Preparation
Risk Management
Request for Proposal
ENGINEERING & MANUFACTURING DEVELOPMENT (EMD) PHASE
Milestone B
Manage Program Backlogs
Release Execution
Manage Contracts
Metrics
Scaling Agile
Metrics
Programs that adopt Agile methods must tailor the metrics traditionally used by DoD to reflect the different processes and artifacts used in Agile.
Introduction to Agile Metrics
Agile metrics focus primarily on the development team during sprints to track progress over time. Agile teams typically use story points or ideal days (throughout this section, the term work element is used to be inclusive of any estimating technique a team chooses to use [e.g., story points, staff hours, task lists, etc.]) to estimate the work in terms of size which is separate from estimates for duration/actual time. Common methods for tracking Agile team progress are velocity, burn-down charts, and release burn-up charts.
Velocity is the number of work elements completed during a sprint. The velocity is the anticipated number of work elements that the team can complete in a sprint. Since it is an average value based on historical performance, velocity can and will change over time. Velocity is the primary measure of the team’s progress and is a useful tool in planning sprint and release schedules.
Release Burn-down Chart is a graphical representation of the amount of work remaining in the release at the start of each sprint. A burn-down chart may vary across sprints based on for example inaccurate estimates or changes in scope. It may also show a burn-up, meaning work was added due to such things as re-prioritization or under estimating the remaining work. Burn-down charts visualize the net progress; progress minus work added to the release. See also Improving on the Release Burn-down Chart.
Sprint Burn-down Chart is similar to a release burn-down chart and tracks progress of the current sprint. It graphs the number of hours remaining by days of the sprint. The sprint burn-down chart is meant to show work remaining in the sprint and not intended to be used for improving estimations.
These above methods for tracking progress do not align to traditional DoD metrics to validate cost, schedule, performance, and quality of programs and projects. While cost, schedule and performance continue to have meaning in an Agile program, they need to be viewed and managed differently for Agile. A program office and contractor will need to adapt to tracking metrics based on work elements and user stories in relation to sprints and releases. The following paragraphs describe some common metrics a program office could manage within an Agile process.
| Traditional DoD Measures | Characteristics | Agile Measures | See Section(s) |
| Cost | Dollars Resources |
Work Elements Velocity |
Cost Metrics Agile and EVM |
| Schedule | Time Milestones Planning |
Sprint/Release Planning Release Burn-up/down Charts Sprint Burn-down Charts |
Requirement Metrics |
| Performance | Customer satisfaction Customer capabilities Quality (of product) Performance (of contractor) |
User Story Completion and Acceptance Test Coverage |
Performance Metrics Measuring Success |
| Quality | Design and Architecture Development (of code) Test and Integration |
Test Automation Value Delivered Defects Corrected and Escaped |
Quality Metrics Test Results Analysis and Reporting |
Requirements Metrics
User stories offer the best measure of requirements for an Agile program. Evaluating when user stories are being assigned and implemented in a sprint will reflect whether the highest priority features are being addressed to provide the most value to the customer. Unlike traditional methods, metrics about requirements can be collected at regular intervals rather than up-front. Recommended metrics to monitor requirements include those listed in the table below.
| Metric | Used to Answer |
| Number of stories selected for a sprint |
|
| Number of stories completed and accepted during a sprint |
|
| Number of new feature stories added to a product backlog | How much the requirements are changing |
| Number of user stories re-prioritized | How much the user priorities are changing |
| Number of function points completed per sprint | How much business functionality the sprint provides to a user. |
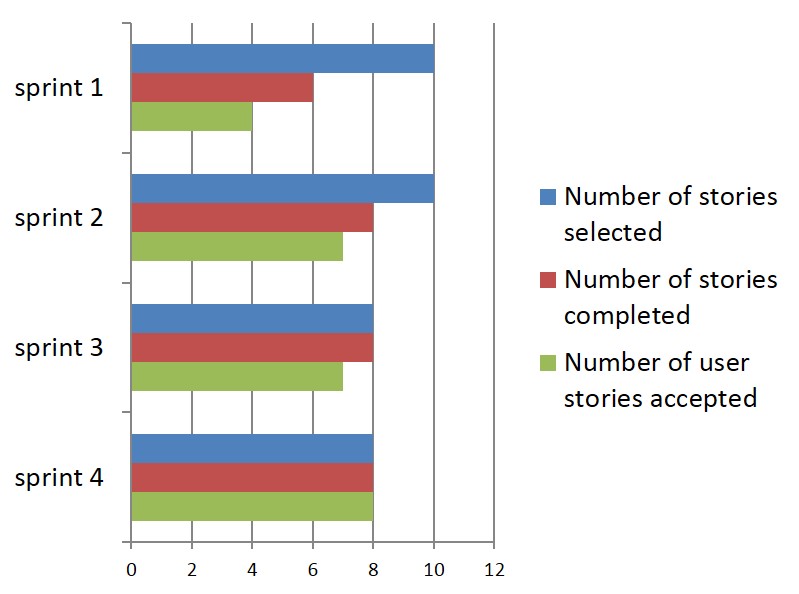 Sample Requirements Metrics
Results that should draw attention to problems include metrics that show the team often fails to complete the number of stories selected for a sprint, or user stories that the team constantly defers (lower priority). Managers must recognize that there are several reasons why a team may not complete selected stories. Perhaps the team routinely underestimates the complexity of the user stories, or lacks some necessary skillsets or the team composition changed, or the introduction of a new tool added a learning curve for the team. Teams may defer user stories from sprint to sprint because of poor estimation. As previously noted, it may take a few sprints for the team to achieve confidence and accuracy in its estimates. The problem could also lie in dependencies between stories. If a high-priority user story depends on one lower in the backlog, the team cannot execute it until after it has completed the less critical item.
Cost Metrics
Cost can be determined based on the number of hours planned and delivered against stories within a sprint. The costs per story metrics are subjective, and vary according to the complexity of the stories in a sprint and the number of team members contributing to that sprint. Work elements are typically not equivalent to time, and programs must take this into consideration when evaluating these metrics. As described previously, teams may also need several sprints to “normalize” their estimations/velocity, and the cost per work element may fluctuate in the beginning. This metric depends heavily on the accuracy of the estimates and stability of the team’s velocity. Recommended metrics to manage cost include those listed in the table below.
| Metric | Used to Answer |
| Total work elements committed to sprint | Projected cost of work scheduled |
| Total hours planned per story in sprint | Projected cost per story |
| Actual hours logged against each story in sprint | Actual cost of work performed |
| Actual work elements completed in sprint | Cost of work completed for potential delivery |
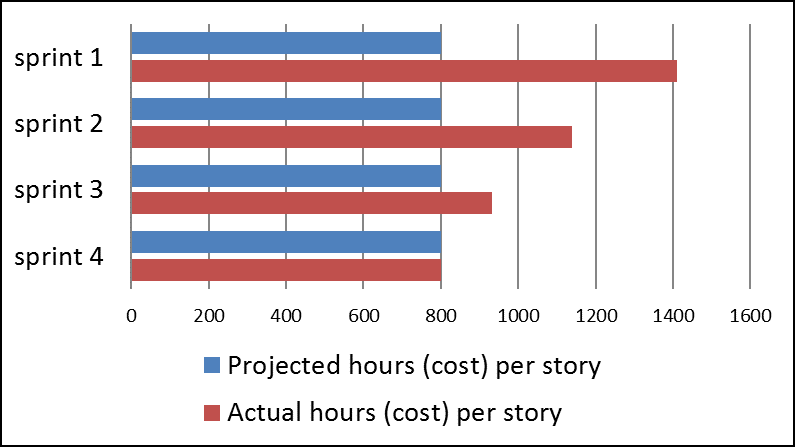 Sample Cost Metrics Charts
Since cost metrics are based on work elements and velocity, inaccurate estimates throw off the planned versus actual costs. Furthermore, selecting stories and estimating hours for stories within a sprint occur for near-term/current releases where details are known. For later releases, another method will be required to estimate cost. For example, a relative sizing technique could be used to compare the relative size and labor of known releases with future releases where less detail is known. Programs must consider a team’s ability to make accurate estimates when looking at program costs in the early stages. If estimation continues to be a problem, the program management should refer to the suggested guidelines in the Cost Estimation section.
Quality Metrics
Tests should be used to ensure that quality capability is being produced that is as error free as possible. Agile testing practices are similar to those found in traditional projects. However, they are incorporated into the iteration lifecycle. This means that, at every stage of development, tests are being written and run against the entire delivered capability. This enables teams to ensure they are not breaking functionality as they build more features.
Recommended quality and test metrics include those shown in the table below.
| Metric | Used to Answer |
| Number of automated Unit tests | Test coverage of capability |
| Number of automated Integration/System tests | Test coverage of system, ensures that each module works with other modules |
| Number of tests that pass after push to main branch | Identifies potential errors early, ensures the main branch is always in a stable state. |
| Number of manual tests | Automation coverage per sprint, measures the amount of time spent testing by hand and whether more automation would save time |
| Effort to perform manual tests vs. automated tests | |
| Number of bugs discovered by user after sprint | Defect removal efficiency per sprint and quality of feature/capability completed in sprint |
| Number of and severity of defects remaining open after sprint |
Continuous integration is a common practice for Agile teams to support automation and testing. This is the practice of running tests before capability is checked into the main branch of the repository. Then upon check-in, an automated build is executed to validate the changes did not break anything. This process provides immediate feedback if a defect is introduced into the repository and ensures there is always a stable version of the capability or baseline. This is important with multiple developers quickly iterating, to know a feature is being built from a stable point.
Performance Metrics
Agile programs deliver a potentially shippable feature at the end of each sprint, with a more fully functional capability delivered at the end of the release. This iterative approach allows for early detection of potential problems and delays and allows the program to make adjustments that reduce impact on overall program performance and delivery.
Agile processes also include and engage the stakeholders throughout the entire project lifecycle. Stakeholder involvement throughout the Agile process helps the development team to quickly and easily clarify requirements and respond to user requests, thus implementing features more likely to be accepted by the user. User acceptance of capabilities for each user story means that the team is fulfilling requirements and responding to change. This means that Agile projects create high-quality products, well aligned with stakeholder expectations.
Recommended metrics to monitor performance (e.g., how well team is meeting sprint goal and schedule) include those shown in the table below.
| Metric | Used to Answer |
| Number of user stories accepted at end of sprint | How well team is meeting sprint goal and successfully addressing user high priority needs |
| Number of errors discovered by user after release | The quality of the delivered capability |
| Number of tests planned | The performance and effectiveness of the testing process used during the sprints and releases |
| Number of tests completed/executed | |
| Number of tests that passed |
The following figure shows sample performance metrics.
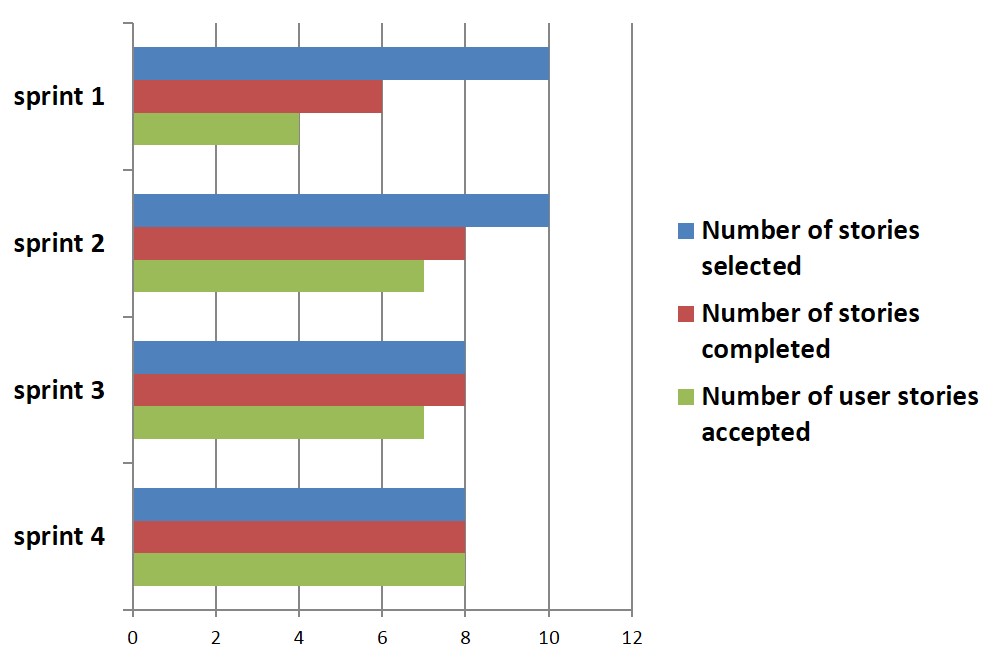 Sample Performance Metrics
The iterative nature of Agile allows for more frequent collection of metrics. Programs must balance the benefits of timely and useful metrics against the burden that collecting and reporting the metrics places on the team. Programs should determine a frequency that reflects when significant changes or trends can be observed and changes may be made.
Ideally, programs should use tools that automatically collect and report metrics. Most Agile management tools track, manage, and report metrics out of the box.
Test Results Analysis and Reporting
Agile defines success as providing value, so Agile project and test metrics should be different. In The Yin and Yang of Software Metrics, Galen and Bradshaw describe metrics that provide the right level of visibility and information. Key metrics include those associated with “exit criteria,” such as test execution status by priority, overall pass rates, and percentage of defects corrected by severity. These metrics answer such questions as:
- Have we tested enough?
- Have the right stakeholders been involved?
- What is our coverage of the functionality?
The overall pass rates identify blockages and the ratio of working software and patterns to failures. Metrics associated with the percent of defects corrected by severity over time reveal the team’s ability to make repairs and the gradual maturity of the software. Galen and Bradshaw cite four agile development team metrics:
- Value delivered
- Velocity and throughput
- Quality
- Team morale and satisfaction
These key metrics can be tailored to reflect not just the product team measures but testing specifically. Velocity – traditionally the number of story points produced per sprint – can be adjusted to reflect the number of story points that have successfully passed testing. Velocity should trend up. Throughput—the number of “days” a story was in progress relative to its size—can also be adjusted to reflect the testing related to the number of hours a story takes to complete test successfully relative to its size. Throughput should trend down. Galen and Bradshaw suggest that metrics specific to product quality include measures related to:
- Test automation—such as counts of check-ins and automation runs
- Defect escapes—defects that elude tests of doneness criteria, discovered in a sprint other than the one they were created in, and escapes that make into releases and production
Agile Test Team Roles
| Role | Description |
| System test coordinator | Plans and coordinates all the system testing activities and the system test team |
| Testers in Agile team | Contribute to the “definition of done”; develop and execute tests; create testing frameworks and automated tests; prepare test data; review testability |
| Independent Test Teams (end-to-end, integrators, performance, security etc.) | Create test platforms and automation frameworks; design; and execute; system-level testing; address cross-system concerns; coordinate enterprise/ system testing |
| Test Architect (cross-team role) | -Defines test strategy across all scrum teams; establishes non-functional test approach; influences consistent application architecture |
| Automation Architect (cross-team role) | Leads analysis; serves as POC for new automation needs; ensures that automation is consistent among the teams; lays the foundation for an automation framework for all teams |
Often large-scale enterprise Agile systems may require the involvement of additional independent teams of testers that execute system-/enterprise-level testing and integration. These teams may be internally or externally sourced using contract vehicles.
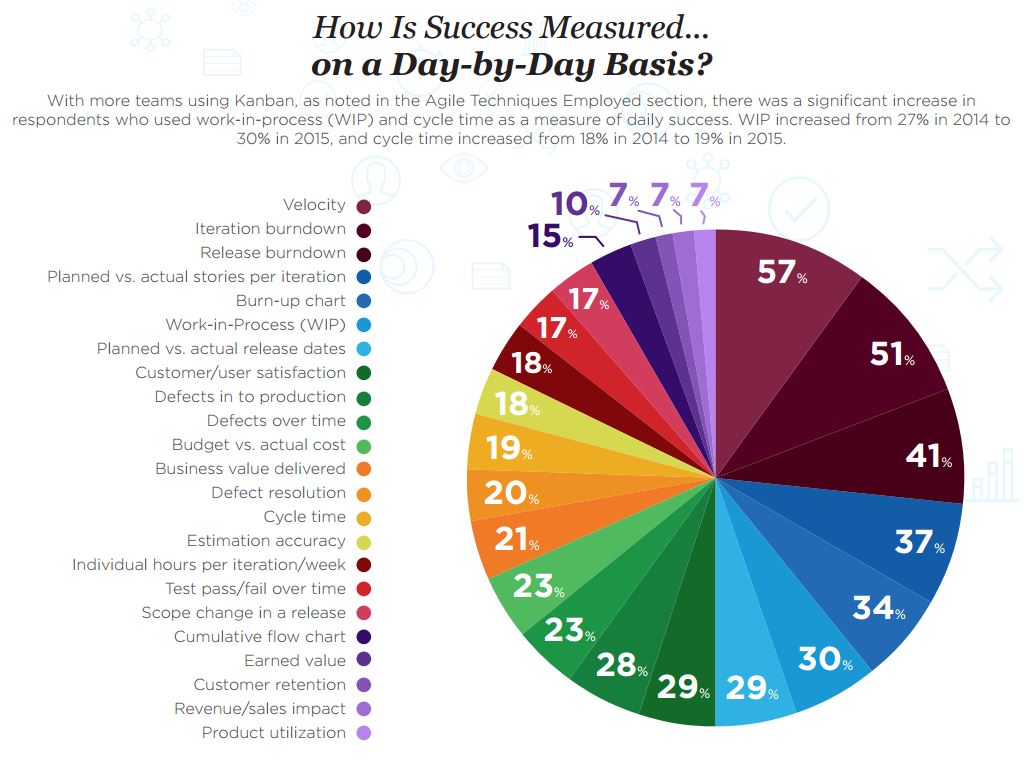
Measuring Success
VersionOne’s 10th Annual State of Agile Report surveyed over 3,800 Agile practitioners with the following summaries on success measures. 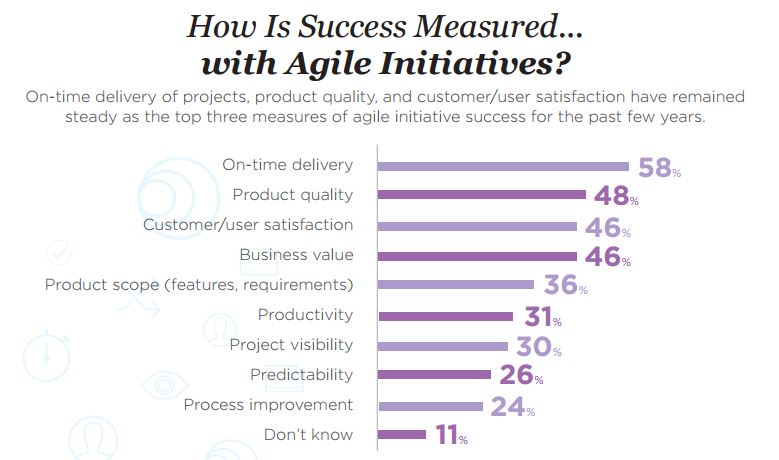
Agile and Earned Value Management (EVM)
Earned Value Management (EVM) for an Agile development program has been debated across federal acquisition and Agile communities. The value and effective implementation of EVM in traditional acquisition programs has also been an ongoing challenge. A 3 Jul 07 OSD/AT&L memo highlights:
“EVM is considered by many in the project management community to be the best option currently available for holding all parties accountable for the effective management of large and complex projects. EVM provides a disciplined approach to managing projects successfully through the use of an integrated system to plan and control authorized work to achieve cost, schedule, and performance objectives. The fidelity of the information produced by the EVM System is critical to providing an objective assessment of a program’s performance from which well-informed management decisions can be made. Moreover, EVM is not just a cost report; it is a tool to help program managers and their team members operate more effectively in managing their programs.”
Contract type is a key consideration with EVM. EVM is required on cost or incentive contracts at or above $20 million. Use of EVM on FFP contracts is limited to only when the PM believes there is significant schedule risk, which should not be the case with time-phased releases in Agile. EVM does not apply to T&M/Services contracts. See the DoD EVM website for official policies and FAQs.
Given the dynamic and iterative structure and processes of Agile, implementing an EVM system can pose a significant challenge with little value. Agile embraces responding to changes, not “controlling authorized work”. As changes are made throughout development, effective reporting against cost, schedule, and performance against a baseline is difficult. The metrics outlined in this section meet the intent of EVM to provide a disciplined approach to manage programs by providing key insight into progress and issues.
Humprhreys and Associates outlines the differences in EVM vs Agile Project Management.
| Agile | EVMS |
| Minimal Documentation | More Documentation |
| Plan at last moment | Plan ahead to end of project |
| Scope is flexible | Scope is baselined and controlled |
| Expect and embrace change | Avoid and/or control change |
| Schedule (Sprint) is fixed. Timebox ends the Sprint. |
End the package when the work is done. |
| Budget is secondary. | Budget is baselined and controlled |
| Cost collection is not mentioned | Cost collection at the right levels is critical |
OSD/AT&L recently published an Agile Earned Value Management Guide for Program Managers to outline how DoD programs can be Agile and while maintaining EVM system compliance. It covers organization of the WBS, planning and scheduling, measuring progress, baseline maintenance, and compliance with EVM systems.
Key Questions
- What metrics does the Program Management Office use to manage the program?
- Which of these are provided by the contractor and which by the government?
- How will these metrics be collected and used? What types of decisions will be made as a result?
- What metrics are shared with program stakeholders? With senior leadership?
- What contractor incentives are tied to these metrics?
- Are a process and culture in place to ensure accurate data is collected?
References
- Metrics for Software Development, Defense Innovation Board, Jul 2018
- Measures of Success in an Agile Organization, GSA Tech Guide
- Agile Metrics: Progress Monitoring of Agile Contractors, SEI, Jan 2014
- Agile Metrics: Seven Categories, Will Hayes, SEI, Sep 2014
- Agile Earned Value Management – A Program Manager’s Guide, OSD/AT&L/PARCA, Mar 2016
- Earned Value Challenges in An Agile Acquisition Paradigm, Gary Bliss, PARCA, 2015 EVM World
- Project Management’s Not So Odd Couple (EVM and Agile) By John Zyskowski, FCW
- AgileEVM: Measuring Cost Efficiency Across the Product Lifecycle by Tamara Sulaiman, InfoQ
- Stakeholder Needs and Expectations, Planning your Agile Project and Program Metrics by William A. Broadus III, DAU
0 Comments